Many designers treat U-factor as a rough target to approach rather than a precise design output to hit. That's where performance gaps begin. In Passive House construction, the wall U-factor must account for the full composite assembly: structural framing, sheathing, insulation layers, cladding attachments, air barriers, and interior finishes. Misunderstanding this — defaulting to center-of-cavity or manufacturer-rated R-values instead — is one of the most common reasons certified performance targets are missed in the field.
This guide covers what U-factor actually measures in a wall assembly, what the certified target range is, what shifts it in practice, how it's verified, and what goes wrong when it's misspecified.
Key Takeaways
- U-factor measures heat flow through a wall per unit area per degree of temperature difference (W/m²K) — lower is better
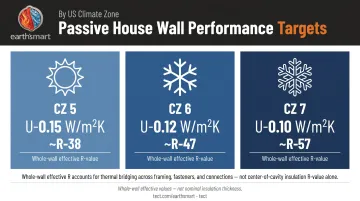
- Passive House walls typically require U ≤ 0.15 W/m²K (~R-38 effective whole-wall); colder US climate zones require 0.10–0.12 W/m²K
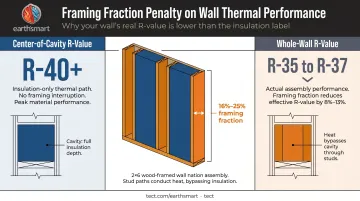
- Framing fraction and thermal bridges can raise whole-wall U-factor 30–50% above insulation-only estimates
- PHPP and WUFI Passive require as-built assembly U-factors — not idealized datasheet figures
- Exceeding the U-factor target increases heating demand and raises condensation and mold risk on interior surfaces
What U-Factor Represents in a Passive House Wall
How Thermal Transmittance Is Defined
ISO 6946:2017 defines thermal transmittance as the steady-state heat-flow rate divided by area and the temperature difference between interior and exterior environments. The unit is W/m²K. U-factor is the reciprocal of total thermal resistance: U = 1/R_total.
That total resistance includes:
- Internal surface resistance (R_si)
- Each material layer resistance (R = thickness ÷ thermal conductivity, or d/λ, where λ is thermal conductivity)
- External surface resistance (R_se)
This matters because surface resistances alone account for roughly 0.17 m²K/W on the interior and 0.04 m²K/W on the exterior — values that are part of the calculation but don't appear on any product datasheet.
Why a Single Material's R-Value Is Not an Assembly U-Factor
Thicker insulation and lower-conductivity materials both reduce U-factor, but neither operates in isolation in a composite wall. A 2x6 stud wall filled with mineral wool has a very different U-factor than the mineral wool's R-value per inch would suggest. The studs, sheathing, interior finish, and surface films all participate in the thermal calculation.
For Passive House walls, U-factor is a design output, not a material label. It must be calculated for the specific assembly based on the full cross-section. Looking it up from a product datasheet or extrapolating from insulation thickness alone will produce an inaccurate result.
Every layer contributes — which is why assembly-level calculation is the only reliable approach:
- Framing members create thermal bridges that bypass insulation layers
- Sheathing and interior finishes add resistance the insulation spec ignores
- Surface films contribute fixed values that are part of every compliant calculation
Factors That Shift Wall U-Factor Beyond Insulation Alone
The Framing Fraction Effect
Structural framing creates a parallel heat flow path through the wall. Wood has a much higher thermal conductivity than insulation, so wherever there's a stud, heat moves faster.
According to the American Wood Council citing ASHRAE, framing factors for wood stud walls are:
- 25% of wall area at 16-inch on-center spacing
- 22% of wall area at 24-inch on-center spacing
Building Science Corporation uses a 16% framing factor for advanced-framing examples. That difference in framing fraction has a measurable effect on whole-wall U-factor.
A concrete example: BSC's verified assembly data shows a 2x6 advanced-frame wall at 24-inch on-center with cellulose cavity insulation and 4 inches of exterior mineral fiber board achieves a whole-wall R-35 to R-37 — even though the cavity insulation alone would suggest higher performance. The exterior continuous insulation is doing substantial work to suppress the framing penalty.
Thermal Bridges at Key Junctions
Framing fraction spreads heat loss evenly across the wall plane. Point and linear thermal bridges are concentrated — discrete locations where heat bypasses the insulation entirely:
- Window bucks and sill/jamb/head junctions
- Rim joists at floor-to-wall connections
- Cladding attachment clips and fasteners penetrating the insulation plane
- Balcony slab connections (among the worst offenders)
These are quantified using psi-values (Ψ, W/mK) for linear bridges and chi-values (χ, W/K) for point bridges. Passive House design treats a thermal bridge as negligible when Ψ ≤ 0.01 W/mK — the "thermal-bridge-free" threshold.
Anything above that value must be explicitly modeled in PHPP or WUFI Passive as an addition to the opaque wall heat loss.
Eliminating or minimizing these bridges typically requires thermally broken window installation details, continuous exterior insulation across the framing plane, and careful selection of cladding attachment hardware.
Target U-Factor Range for Passive House Walls
The PHI Benchmark
The Passive House Institute certification criteria identify U ≤ 0.15 W/m²K as the benchmark for opaque wall elements in cool-temperate Passive House design. This is the cost-optimal insulation threshold — not arbitrary, but derived from economic analysis of marginal insulation investment versus energy savings at Central European energy prices.
Using the NIST unit conversion (1 m²K/W = 5.678 ft² °F h/Btu):
| U-factor (W/m²K) | Equivalent whole-wall R (US IP) | Typical Climate Zone |
|---|---|---|
| 0.15 | ~R-38 | Temperate (CZ 4–5) |
| 0.12 | ~R-47 | Cold (CZ 6) |
| 0.10 | ~R-57 | Very cold (CZ 7) |
Nominal Targets by Climate Zone
PHIUS uses climate-specific envelope targets rather than a single universal value. Extracted data from the Phius 2021 Certification Guidebook shows wall R-value ranges of:
- CZ 5: R-32 to R-48
- CZ 6: R-40 to R-68
- CZ 7: R-44 to R-92
These are whole-wall effective values — not center-of-cavity, not nominal insulation thickness. For California projects in mixed-climate and coastal zones (CZ 3–4), the target is less demanding than CZ 6–7, but still requires deliberate assembly design to hit that number reliably.
That distinction matters for US-based designers. Achieving R-38 effective whole-wall requires more installed insulation than R-38 center-of-cavity, because framing and thermal bridges reduce the effective R-value below the cavity insulation's nominal rating. A wall targeting U-0.15 will typically need R-20+ of continuous exterior insulation combined with an insulated cavity, depending on framing type and spacing.
Designing to a Safety Margin
Passive House designers typically target 5–15% below the maximum certified U-factor. Designing exactly to the certified boundary is risky — construction tolerances shift, materials vary, and modeling assumptions don't always hold in the field. Any one of those factors can push the energy balance calculation the wrong way.
When a wall U-factor is slightly above target, it's not necessarily fatal — PHPP is a whole-building energy balance, and improved window performance, reduced infiltration, or favorable orientation can compensate. That flexibility disappears, however, as other envelope parameters approach their own limits. Once the wall U-factor becomes the binding constraint, fixing it mid-construction is expensive — and often impossible without tearing back completed assemblies.
What Determines Real-World Wall U-Factor in Practice
Center-of-Cavity vs. Whole-Wall: The Gap That Matters
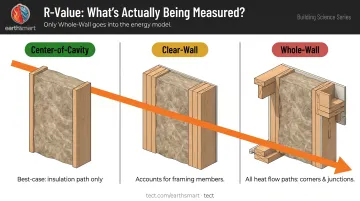
ORNL's thermal performance research distinguishes three distinct R-value categories:
- Center-of-cavity — performance through the most-insulated point in the cross-section
- Clear-wall — accounts for framing members but not corner and junction details
- Whole-wall — accounts for all parallel heat flow paths and geometric details
Center-of-cavity is the best-case number. Whole-wall is the number that goes in the energy model. The gap between them depends on framing method, spacing, and whether exterior continuous insulation is present.
How Continuous Exterior Insulation Changes the Equation
Continuous exterior insulation (CI) works by placing a thermally resistive layer outside the structural framing. This produces two effects:
- Suppresses the framing fraction penalty — the CI layer applies uniformly across studs and cavities alike, reducing the relative contribution of the stud heat path
- Shifts the dew point location — moving insulation to the exterior raises the temperature of the sheathing layer in cold weather, reducing condensation risk within the assembly
The BSC mineral fiber example cited earlier (2x6 framing at 24-inch on-center with 4 inches of exterior mineral fiber) illustrates this directly. That 4-inch CI layer is what moves whole-wall performance from a typical wood-framed R-20 range up to the R-35+ range Passive House requires.
The ratio of CI to cavity insulation also matters for hygrothermal performance (the combined behavior of heat and moisture in the assembly). In colder climates, insufficient exterior insulation leaves the sheathing cold enough to accumulate moisture. That condensation risk must be assessed using tools like WUFI or the simplified dew-point method from EN ISO 13788.
Long-Term Degradation: A Factor for 100+ Year Homes
Design U-factors should reflect long-term in-service performance, not just initial installed values. Three degradation mechanisms matter here:
- Polyisocyanurate (polyiso) thermal drift: Building Science Corporation's Info-502 documents that polyiso R-value decreases as outside temperatures drop below freezing. A product rated at R-6/inch at 75°F mean temperature may perform significantly below that in cold-climate exterior applications. PIMA's Long-Term Thermal Resistance (LTTR) testing is conducted at 75°F mean — not at the low temperatures where cold-climate walls actually operate.
- Fiber insulation settling: Batts and blown fiber can compress or settle under load, reducing cavity fill and increasing effective heat flow.
- Moisture absorption: Any insulation exposed to sustained moisture accumulation will see increased effective thermal conductivity.
For homes designed to last a century, using the initial rated R-value as the design basis is optimistic. For polyiso in cold-climate exterior applications specifically, apply a derated performance value — not the rated R-value — when modeling the assembly.
Earth'smart powered by tect's Earth'smart™ approach specifies non-combustible wall assemblies, including pre-insulated concrete masonry, ICF, and AAC. These systems integrate structural and insulation functions in a single assembly that doesn't settle, compress, or drift thermally the way foam-board or batt systems do — which sidesteps several of these degradation concerns by design.
Installation Quality: The Variable That Doesn't Appear in Calculations
Every U-factor calculation assumes perfect installation. The actual wall doesn't.
Common installation defects that degrade real-world U-factor:
- Compressed batt insulation (reduces cavity R-value proportionally to compression)
- Gaps around electrical boxes, pipes, and penetrations
- Misaligned or unsealed joints in continuous insulation board
- Voids at top and bottom plates
Thermal imaging after framing (before drywall) frequently reveals heat flow paths that are invisible during construction and impossible to measure once the wall is closed. Construction verification in Passive House work isn't optional — it's the mechanism that closes the gap between what was specified and what was actually built.
How Wall U-Factor Is Specified, Modeled, and Verified
From Material Properties to Energy Model
Wall U-factor in Passive House design is calculated layer by layer from certified thermal conductivity values (λ-values from tested datasheets or certified component databases), then entered into PHPP or WUFI Passive as the basis for energy balance verification.
The distinction between rated material U-factors (from manufacturer datasheets) and modeled assembly U-factors (from PHPP cross-section calculations) matters. A manufacturer's datasheet gives the product's thermal conductivity. The PHPP calculation takes that conductivity value, applies it across the relevant layer thickness, adds all other layers, includes surface resistances, accounts for framing fraction, and arrives at an assembly U-factor. These are different numbers, and conflating them produces models that overestimate real performance.
Field Verification Methods — and Their Limits
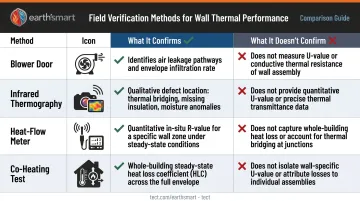
| Method | What it confirms | What it doesn't confirm |
|---|---|---|
| Blower door (ASTM E779 / ISO 9972) | Air-leakage rate through envelope | Opaque wall U-factor |
| Infrared thermography (ASTM C1060 / ISO 6781) | Location of insulation defects and thermal bridges (qualitative) | Quantitative U-factor |
| Heat-flow meter (ISO 9869-1 / ASTM C1155) | In-situ thermal resistance of a wall section (quantitative) | Whole-building performance |
| Co-heating test | Whole-building heat loss coefficient | Wall-specific U-factor in isolation |
Blower door results are frequently cited as performance verification for Passive House walls, but they confirm airtightness, not thermal transmittance. IR thermography is diagnostic, not quantitative. For a confirmed wall U-factor, heat-flow meter measurement per ISO 9869-1 is the appropriate method.
Why Early Coordination Prevents Late-Stage U-Factor Failures
Several decisions directly affect the modeled wall U-factor:
- Framing type and framing fraction
- Cladding attachment system thermal performance
- Window installation details at the rough opening
In conventional design-bid-build delivery, these decisions often aren't resolved until late in construction, after the energy model has been completed with idealized assumptions.
When the actual framing or attachment system differs from the modeled assembly, the U-factor changes. The PHPP calculation that was the basis for certification may no longer be valid.
This is where early coordination pays off. Earth'smart powered by tect addresses this directly by bringing manufacturer expertise into the project through the earth'smart powered by tectApp™ community at the concept stage, not during construction. When the companies behind the wall materials and cladding attachment systems are part of the conversation early, assembly details get resolved against the energy model rather than after it.
Common Misinterpretations of Wall U-Factor That Undermine Performance
1. Treating Center-of-Cavity as the Wall U-Factor
The insulation layer alone doesn't define assembly performance. With typical wood framing at 16-inch on-center (25% framing fraction), the whole-wall U-factor will be substantially worse than what the insulation spec alone implies. PHPP models built on center-of-cavity values will fail when as-built performance is assessed.
2. Applying Manufacturer R-Value Ratings Without Adjustment
Rated values rarely reflect real-world installed performance. Two common adjustments that get skipped:
- Temperature correction: Polyiso rated at R-6/inch can drop to R-5 or less at cold exterior temperatures
- Installation factor: Batt insulation ratings assume perfect installation — zero voids, zero compression
Using rated values without these adjustments leads to systematic underestimation of heat loss.
3. Reporting Wall Body U-Factor Without Thermal Bridges
The wall U-factor used in PHPP must include psi-values at window perimeters, balcony connections, and structural penetrations. The opaque wall body U-factor without these linear bridge contributions understates actual heat loss from the wall zone and misrepresents the assembly's role in the energy balance.
4. Ignoring the Consequences Beyond Energy Demand
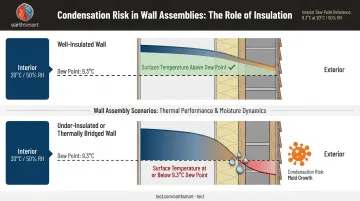
A wall U-factor above the Passive House threshold doesn't just increase annual heating energy. It also raises the risk of interior surface temperatures falling to or below the dew point on cold nights.
At 20°C interior temperature and 50% relative humidity, the dew point sits at approximately 9.3°C. In poorly insulated or thermally bridged assemblies, interior surface temperatures can reach that threshold. When they do, condensation forms on the surface — and sustained surface condensation is the direct mechanism for mold growth. This is a health and durability consequence, not just an energy metric.
Frequently Asked Questions
What is the U-factor of a Passive House wall?
Passive House walls typically achieve U ≤ 0.15 W/m²K (roughly R-38 or higher effective whole-wall in US units), with colder US climate zones requiring 0.10–0.12 W/m²K. This figure represents whole-wall assembly performance — not just the insulation layer — and must account for framing fraction and thermal bridges.
What is the standard insulation for a Passivhaus?
There's no single mandated material. The requirement is a performance outcome — a target U-factor — achievable with mineral wool, EPS, polyiso, wood fiber, or similar. Sufficient thickness, continuous installation, and correct placement relative to the dew point location are what determine success.
What is the difference between U-factor and R-value for walls?
R-value measures thermal resistance; U-factor measures thermal transmittance. They are reciprocals: U = 1/R. U-factor describes the whole assembly including all layers and surface resistances, while R-value is typically quoted for a single material — a critical distinction in Passive House calculations.
What is a thermal bridge and how does it affect wall U-factor?
A thermal bridge is a conductive pathway through or around the insulation layer — such as a steel stud or metal cladding fastener — that allows heat to bypass insulation and raises the effective whole-wall U-factor. Passive House design minimizes these through thermally broken details and continuous exterior insulation.
What is the difference between center-of-cavity U-factor and whole-wall U-factor?
Center-of-cavity U-factor measures thermal performance only through the insulation-filled section of the wall. Whole-wall U-factor accounts for all parallel heat flow paths, including structural framing members. Whole-wall is always worse (higher) than center-of-cavity, and it's the value that must be used in Passive House energy modeling.
Does wall thickness alone determine U-factor in Passive House construction?
Thickness matters, but it's one of several variables that determine U-factor. Thermal conductivity, framing fraction, installation quality, thermal bridges, and long-term degradation all affect the as-built result. Two walls of identical thickness can perform very differently depending on material choice and detailing.